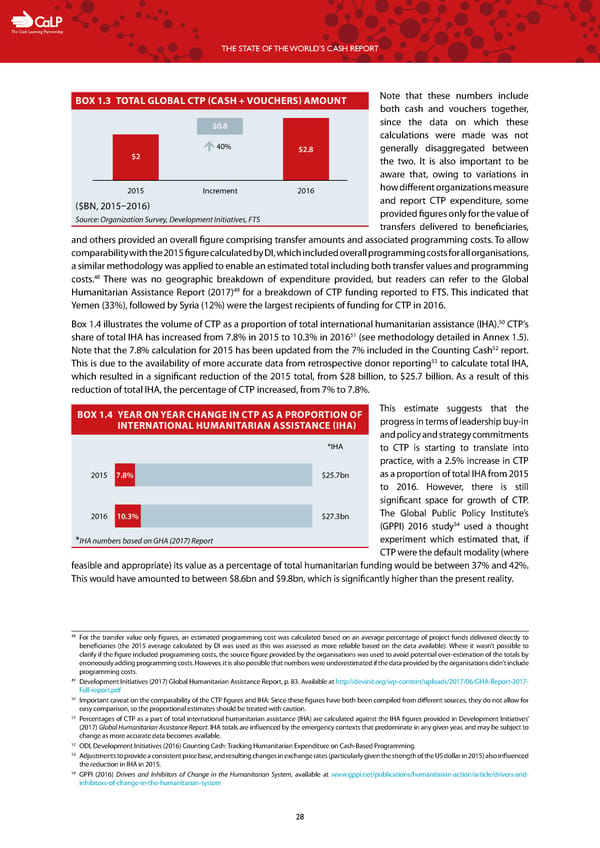
C The Cash Learning Partnership THE STATE OF THE WORLD’S CASH REPORT BOX 1.3 TOTAL GLOBAL CTP (CASH + VOUCHERS) AMOUNT Note that these numbers include both cash and vouchers together, $0.8 since the data on which these calculations were made was not 40% $2.8 generally disaggregated between $2 the two. It is also important to be aware that, owing to variations in 2015 Increment 2016 how different organizations measure ($BN, 2015–2016) and report CTP expenditure, some Source: Organization Survey, Development Initiatives, FTS provided figures only for the value of transfers delivered to beneficiaries, and others provided an overall figure comprising transfer amounts and associated programming costs. To allow comparability with the 2015 figure calculated by DI, which included overall programming costs for all organisations, a similar methodology was applied to enable an estimated total including both transfer values and programming 48 costs. There was no geographic breakdown of expenditure provided, but readers can refer to the Global 49 Humanitarian Assistance Report (2017) for a breakdown of CTP funding reported to FTS. This indicated that Yemen (33%), followed by Syria (12%) were the largest recipients of funding for CTP in 2016. 50 Box 1.4 illustrates the volume of CTP as a proportion of total international humanitarian assistance (IHA). CTP’s share of total IHA has increased from 7.8% in 2015 to 10.3% in 201651 (see methodology detailed in Annex 1.5). 52 Note that the 7.8% calculation for 2015 has been updated from the 7% included in the Counting Cash report. 53 This is due to the availability of more accurate data from retrospective donor reporting to calculate total IHA, which resulted in a significant reduction of the 2015 total, from $28 billion, to $25.7 billion. As a result of this reduction of total IHA, the percentage of CTP increased, from 7% to 7.8%. BOX 1.4 YEAR ON YEAR CHANGE IN CTP AS A PROPORTION OF This estimate suggests that the INTERNATIONAL HUMANITARIAN ASSISTANCE (IHA) progress in terms of leadership buy-in and policy and strategy commitments *IHA to CTP is starting to translate into practice, with a 2.5% increase in CTP 2015 7.8% $25.7bn as a proportion of total IHA from 2015 to 2016. However, there is still significant space for growth of CTP. 2016 10.3% $27.3bn The Global Public Policy Institute’s 54 (GPPI) 2016 study used a thought *IHA numbers based on GHA (2017) Report experiment which estimated that, if CTP were the default modality (where feasible and appropriate) its value as a percentage of total humanitarian funding would be between 37% and 42%. This would have amounted to between $8.6bn and $9.8bn, which is significantly higher than the present reality. 48 For the transfer value only figures, an estimated programming cost was calculated based on an average percentage of project funds delivered directly to beneficiaries (the 2015 average calculated by DI was used as this was assessed as more reliable based on the data available). Where it wasn’t possible to clarify if the figure included programming costs, the source figure provided by the organisations was used to avoid potential over-estimation of the totals by erroneously adding programming costs. However, it is also possible that numbers were underestimated if the data provided by the organisations didn’t include programming costs. 49 Development Initiatives (2017) Global Humanitarian Assistance Report, p. 83. Available at http://devinit.org/wp-content/uploads/2017/06/GHA-Report-2017- Full-report.pdf 50 Important caveat on the comparability of the CTP figures and IHA: Since these figures have both been compiled from different sources, they do not allow for easy comparison, so the proportional estimates should be treated with caution. 51 Percentages of CTP as a part of total international humanitarian assistance (IHA) are calculated against the IHA figures provided in Development Initiatives’ (2017) Global Humanitarian Assistance Report. IHA totals are influenced by the emergency contexts that predominate in any given year, and may be subject to change as more accurate data becomes available. 52 ODI, Development Initiatives (2016) Counting Cash: Tracking Humanitarian Expenditure on Cash-Based Programming. 53 Adjustments to provide a consistent price base, and resulting changes in exchange rates (particularly given the strength of the US dollar in 2015) also influenced the reduction in IHA in 2015. 54 GPPI (2016) Drivers and Inhibitors of Change in the Humanitarian System, available at www.gppi.net/publications/humanitarian-action/article/drivers-and- inhibitors-of-change-in-the-humanitarian-system 28
 The State of the World's Cash | Full Report Page 29 Page 31