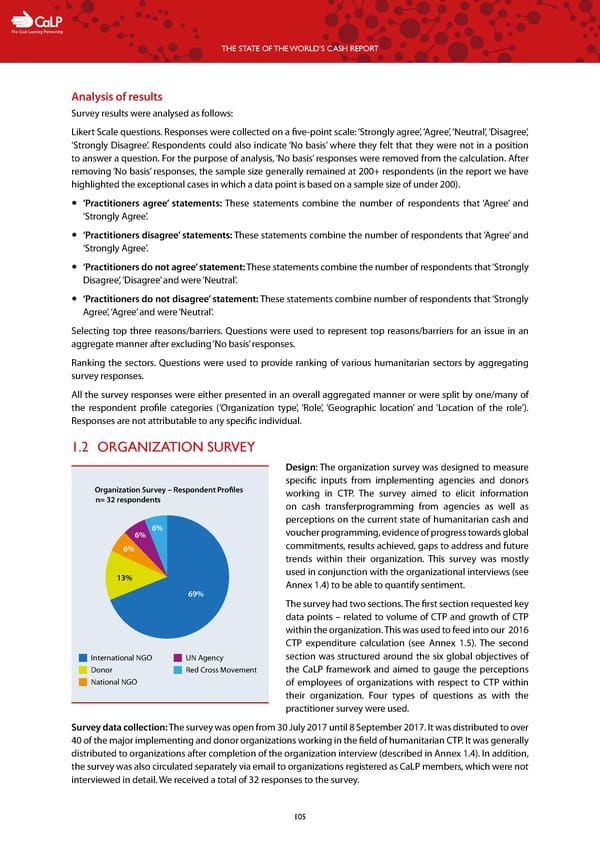
C The Cash Learning Partnership THE STATE OF THE WORLD’S CASH REPORT Analysis of results Survey results were analysed as follows: Likert Scale questions. Responses were collected on a five-point scale: ‘Strongly agree’, ‘Agree’, ‘Neutral’, ‘Disagree’, ‘Strongly Disagree’. Respondents could also indicate ‘No basis’ where they felt that they were not in a position to answer a question. For the purpose of analysis, ‘No basis’ responses were removed from the calculation. After removing ‘No basis’ responses, the sample size generally remained at 200+ respondents (in the report we have highlighted the exceptional cases in which a data point is based on a sample size of under 200). — ‘Practitioners agree’ statements: These statements combine the number of respondents that ‘Agree’ and ‘Strongly Agree’. — ‘Practitioners disagree’ statements: These statements combine the number of respondents that ‘Agree’ and ‘Strongly Agree’. — ‘Practitioners do not agree’ statement: These statements combine the number of respondents that ‘Strongly Disagree’, ‘Disagree’ and were ‘Neutral’. — ‘Practitioners do not disagree’ statement: These statements combine number of respondents that ‘Strongly Agree’, ‘Agree’ and were ‘Neutral’. Selecting top three reasons/barriers. Questions were used to represent top reasons/barriers for an issue in an aggregate manner after excluding ‘No basis’ responses. Ranking the sectors. Questions were used to provide ranking of various humanitarian sectors by aggregating survey responses. All the survey responses were either presented in an overall aggregated manner or were split by one/many of the respondent profile categories (‘Organization type’, ‘Role’, ‘Geographic location’ and ‘Location of the role’). Responses are not attributable to any specific individual. 1.2 ORGANIZATION SURVEY Design: The organization survey was designed to measure specific inputs from implementing agencies and donors Organization Survey – Respondent Profiles working in CTP. The survey aimed to elicit information n= 32 respondents on cash transferprogramming from agencies as well as perceptions on the current state of humanitarian cash and 6% 6% voucher programming, evidence of progress towards global 6% commitments, results achieved, gaps to address and future trends within their organization. This survey was mostly 13% used in conjunction with the organizational interviews (see Annex 1.4) to be able to quantify sentiment. 69% The survey had two sections. The first section requested key data points – related to volume of CTP and growth of CTP within the organization. This was used to feed into our 2016 CTP expenditure calculation (see Annex 1.5). The second International NGO UN Agency section was structured around the six global objectives of Donor Red Cross Movement the CaLP framework and aimed to gauge the perceptions National NGO of employees of organizations with respect to CTP within their organization. Four types of questions as with the practitioner survey were used. Survey data collection: The survey was open from 30 July 2017 until 8 September 2017. It was distributed to over 40 of the major implementing and donor organizations working in the field of humanitarian CTP. It was generally distributed to organizations after completion of the organization interview (described in Annex 1.4). In addition, the survey was also circulated separately via email to organizations registered as CaLP members, which were not interviewed in detail. We received a total of 32 responses to the survey. 105
 The State of the World's Cash | Full Report Page 106 Page 108